

Treeline Analytics Tips and Tricks: Quick Health Exam

By Joe Foster, Edelweiss/Treeline Education and Outreach Coordinator
Your store’s inventory is a huge investment and, besides payroll and rent, is likely the biggest investment you have. Your investment in rent hopefully pays off for your business by providing a welcoming and comforting space for your customers. Your payroll hopefully pays off by giving those customers friendly and competent people with whom they can interact. Your inventory hopefully pays off by giving those customers an interesting and diverse array of products to discover and, of course, purchase.
That inventory investment is where Treeline Analytics can help. As we like to say, “If you can’t measure it, you can’t fix it.” For many stores, inventory is a huge asset, turning over briskly and profitably maximizing that beautiful retail space. Unfortunately, for other stores, inventory can be a great growing weight, sitting bloated and stagnant and weighing down rather than buoying up.
When asked to evaluate the health of a store, we tend to quickly look at three screens to get a general feel for what is happening: Market Top Sellers, Trends, and the In-Stock Bar Chart. We’ll discuss each briefly below. Follow along by looking at these screens in your own Treeline Analytics account, if you like.
Market Top Sellers
On this screen, in this instance, we’re looking to see if you have those big books in stock. The truth is, people mostly hear about books from the same places. As many of those places are disappearing, the ones that still exist are ever more important. There is, inarguably I think, a point at which a book sort of suddenly inhabits the collective unconscious and suddenly that’s the book everyone needs to read. This can be frustrating for a professional, discerning reader since it seems it’s rarely the most “deserving” of books that reach that level. These are potential sales, however. Some stores choose not to carry such books, in protest if nothing else. This is fine, of course, and these stores and these buyers have every right to make such a decision, but that decision does not come without a cost.
All that said, this is often the first thing we look at:
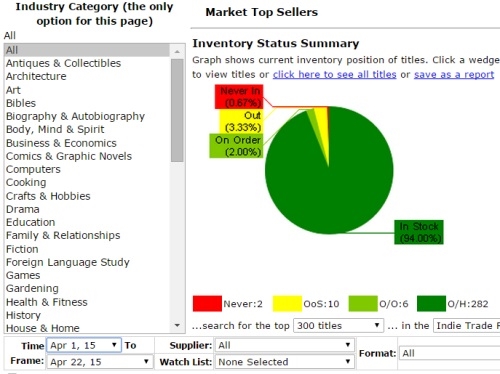
This image shows a store that does, indeed, carry the “big” books — those titles currently selling the best throughout the country. (The dark green slice of the pie represents what it has in stock.) Of course, these are not all the titles this store carries and it undoubtedly has a wonderful selection of unique and surprising gems throughout the store. I submit that the store is more able to experiment and expand its selection because these big titles finance such experimentation. I would click through to see which titles the store is missing and be sure there’s nothing funny happening.
Trends
The Drilldowns Analyze: Trends screen in Treeline is where you’ll find your “report card.” On this screen, you can see, at a glance, a store’s gross sales, average inventory, turns, etc., and how those elements have changed over the last few years (looking at the entire store by viewing All Industry Standard Categories). Here’s a snapshot of a different store that is, frankly, kicking some serious butt.
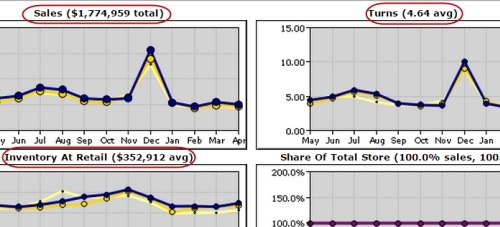
Turns are simply one indicator of the health of a store’s inventory. Cost of goods sold and all that fun stuff plays a part. A store that sells mostly used inventory will often have lower turns, because of the nature of how used books are purchased for stock. Also, sideline/gift items often have lower turns, since you often buy them in bulk. Still, high turns often mean high profitability and are an important factor to consider.
You can see that inventory has crept up in the last few years for this store (the lower left, dark blue line is the last 12 months, yellow lines represent previous years). Sales have been creeping up, too, so that might be a good thing. Inventory creep is something to watch out for, however.
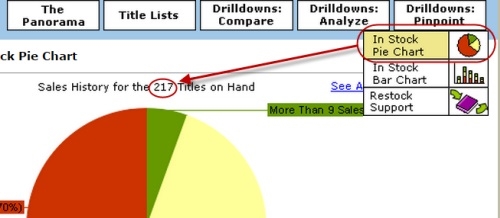
In-Stock Pie Chart
This chart shows, quickly, how a store is doing on its returns. Ridding yourself of unsold inventory is a crucial step in maintaining a healthy bookstore. Returning stock that customers ended up not wanting can be a wonderful way to help a buyer understand what works for the store and what does not. If your inventory is a conversation with your community, what you put on the shelves is what you “say” to them. Their response is what they buy or, of equal importance, what they don’t buy.
In the Drilldowns Pinpoint: In-Stock Pie Chart screen, set your “last received before” date to, say, a year back. Make your timeframe match that time, and you’ll see titles that have been sitting on your shelves for more than a year without selling. For stores with a regular and regimented returns schedule, the number of unsold titles will be relatively small. For example, this store has only 217 titles that have been sitting on the shelves for more than a year. With a number this low, these are most likely titles with which this store has chosen to be lenient.
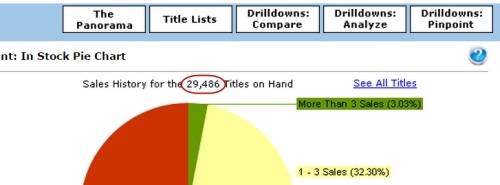
Conversely, here’s a store that has clearly not done returns in a very long time. It has almost 30,000 unsold titles in the same time frame as the store above. Just think for a second how much cash 30,000 titles represents.
That’s the quick tour, showcasing a few graphs to gauge a store’s inventory “health.” We checked out how they’re stocked on those big titles, their turns and yearly sales, inventory trends, and returns habits. Of course, this is not a comprehensive view of a store, but it all serves as a pretty relevant snapshot.
Questions? Don’t hesitate to contact the Treeline Analytics support staff at [email protected].