
- Categories:
E-commerce Update: New Customers Heading to Store Websites
Here, the IndieCommerce team shares an important look at current trends in the world of e-commerce.
We’re actively tracking sales and traffic across the entire IndieCommerce (IC) and IndieLite (IL) network and will be giving you weekly updates on the trends we are seeing.
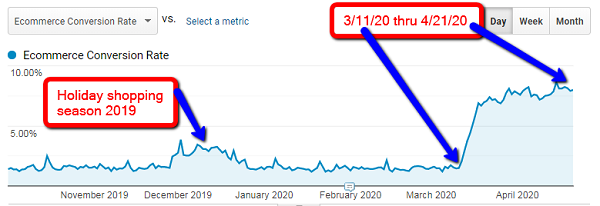
The graph below shows the changes in the e-commerce conversion rate. This is the percentage of users/customers that complete a transaction online with an IC or IL website. For comparison, we’ve included the 2019 holiday shopping season with a peak conversion rate of 3.86 percent on December 2, 2019. On April 21, 2020, the rate was 7.99 percent and has been consistently hovering around 8 percent this week. The graph also indicates that the rate is still trending upward since March 11.
The next big change we are tracking is the number of new customers now shopping at IC and IL websites. Here is a year-over-year comparison for March 12 through April 21. Under normal circumstances, we would expect to see about a 20 percent increase in traffic/users daily. What we are actually seeing during this period is a 99.79 percent average increase in traffic/users compared to 2019.
Watch BTW for details about an upcoming Marketing Meetup that will focus on retaining these new customers. Marketing Meetups are open to all ABA members.
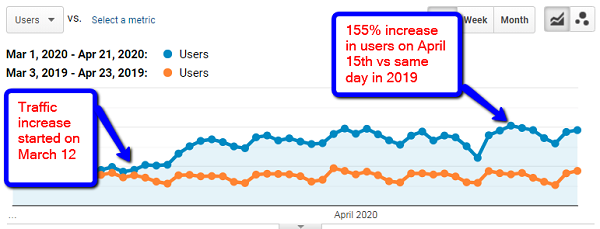
*Because traffic fluctuates by the day of the week, the graph above has been adjusted so that the same day of the week in 2019 can be compared to the same day in 2020.