

- Categories:
E-commerce Update: Online Seasonal Traffic & Sales Patterns
- By Emily Behnke
The dips and rises in traffic and sales that you may be seeing in your Google analytics report may reflect normal seasonal and weekly fluctuations in online traffic and sales. In the graph below, the IndieCommerce team compared the e-commerce conversion rate over the past seven days to the same week in 2019 (pre-pandemic). The e-commerce conversion rate is the percentage of online customers who complete an online transaction. The IC team used the same week in 2019 (orange graph) for comparison and adjusted the period so that you can see how changes in the conversion rate fluctuate based on the day of the week. Notice the dip on Saturday May 15th earlier this week (blue graph), and the similar dip on Saturday May 18, 2019, (orange graph).
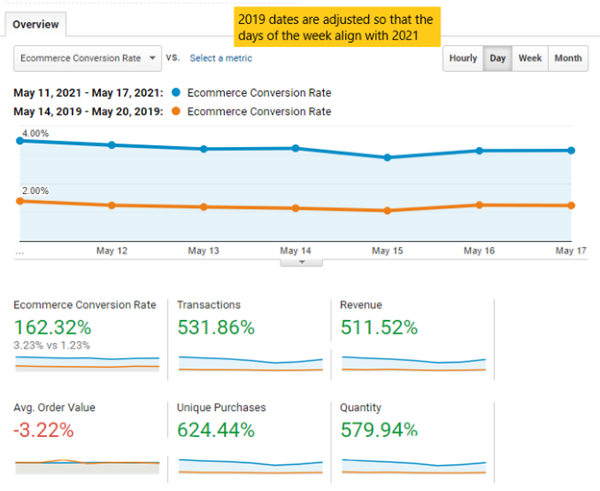
Over the past 7 days (blue graph above), there has been a -8.9 percent drop in the conversion rate, but that is actually less than the -11.21 percent decrease seen that same week in 2019. So, what we are seeing right now online are normal seasonal decreases in the conversion rate as we approach the summer months.
Keep in mind that, yes, we are seeing a seasonal drop in the conversion rate, but when compared to sales revenue for those two weeks, last week’s sales were up 511.52 percent.