

- Categories:
E-commerce Update: Pre-COVID Trends, Sales Still Up
- By Emily Behnke
Two-Week Online Sales & Traffic Trend
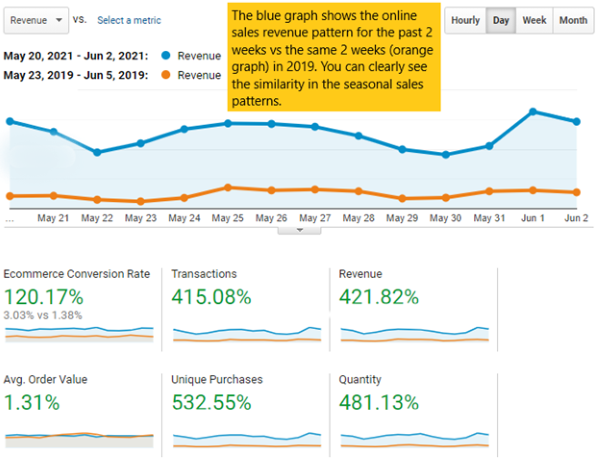
For this update, we’ll be looking at the sales trend for the past two weeks (blue graph), compared to the same period pre-COVID in 2019 (orange graph). The 2019 dates have been shifted so that the days of the week align with 2021. The two graphs show a similar ebb and flow in their sales patterns. Sales are still up 421.82 percent compared to our pre-COVID 2019 sales for this period.
When comparing the customer traffic patterns for these two weeks over the same two year period, you also see a similar trend.
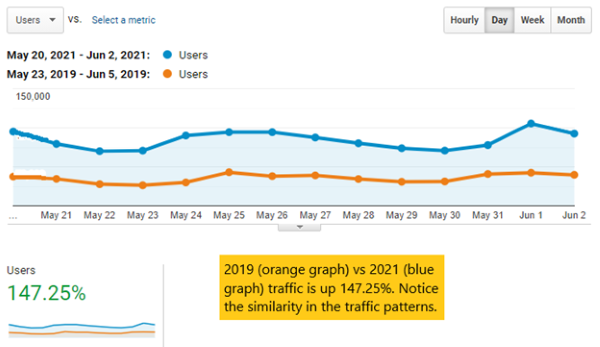
If this year’s traffic pattern continues to mirror what we saw in 2019, expect to see a slight drop in traffic going into July and August with traffic starting to rise again as we move into September and October.