- Categories:
E-commerce Update: Comparing 2021 Weekly Sales and Traffic Online to 2019 [5]
Here, the IndieCommerce [6] team shares an important look at current trends in the world of e-commerce.
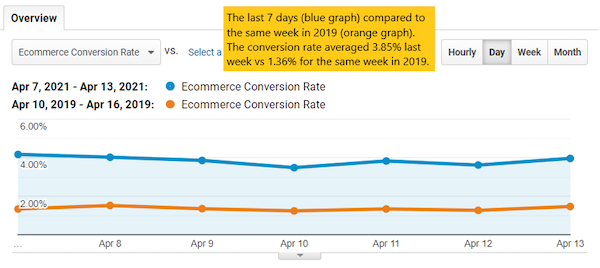
In this week’s report we’re comparing the past seven days (blue line below) to the same week in 2019 (orange line below) — pre-COVID times. The e-commerce conversion rate (the percentage of customers who complete an online purchase) over the past week is 182.63 percent higher than 2019. Although there is a big difference in the average conversion rate, the weekly patterns are quite similar, decreasing over the weekend and increasing as the week progresses.
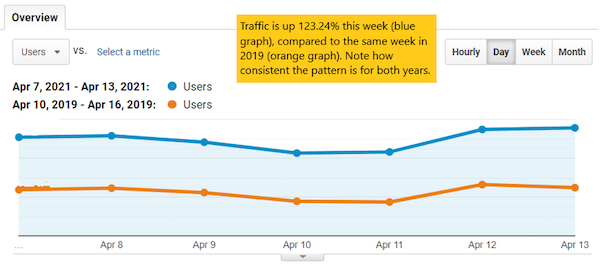
The traffic patterns for the two weeks represented show a 123.24 percent increase in traffic last week (blue line below) when compared to the same week in 2019 (orange line below), but the daily ebb and flow of traffic during each week is almost identical.
If you are looking for online sales and traffic predictions, keep in mind that the trends in traffic and sales from your website’s 2019 Google Analytics data can be an indicator of normal seasonal patterns. The trick is determining where the current elevated online traffic and sales rates will eventually settle in the post-pandemic world.