- Categories:
Treeline Analytics Tips and Tricks: Some Stats for Your Consideration [4]
 [5]
[5]
By Joe Foster, Edelweiss/Treeline Education and Outreach Coordinator [6]
We say, often, that if you don’t “measure it,” you won’t “fix it.” This is generally in reference to the performance of titles or categories in your store, or even the overall health of your store. When it comes to overall store turns, you’re likely working towards a specific goal. Reaching that goal can be pretty tough, as increasing your turns can be a difficult process. (Turns can be calculated by dividing your annual sales by your average inventory. You can use either wholesale or retail values, but be sure to use the same one for both numbers. Your POS system may offer a way to calculate this, or if you’re a Treeline store, simply check out the Trends screen.) So, increasing turns is either done by increasing sales or decreasing inventory. One is much easier than the other.
We thought we’d offer up an aggregation of Treeline data to help you figure out how you’re doing as far as turns go in relation to other stores. Having a goal to work towards is great, but so often you’re working in the vacuum chamber of your own store without any real idea of how your hard work might stack up against others who are working equally hard, often with the same basic challenges. We encourage you to run whatever reports you need to run, or to log in to Treeline Analytics if you’re a subscriber, and take a look.
The stats:
Treeline Analytics breaks stores down into regions around the U.S.: Northeast, South, Midwest, Mountain, and West. Among the almost 300 Treeline stores, the average turn nationwide is sitting at 2.21.
Regional turns break down like so:
- Northeast: 2.05
- South: 2.03
- Midwest: 2.15
- Mountain: 2.56
- West: 2.33
The average inventory level nationwide is around $570,000 (retail dollars).
The average retail level among each region look like this (numbers have been rounded just a bit):
- Northeast: $775,000
- South: $450,000
- Midwest: $510,000
- Mountain: $487,000
- West: $631,000
Averrage annual sales nationally are around $1.2 million.
Regionally:
- Northeast: $1.6 million
- South: $914,000
- Midwest: $1.1 million
- Mountain: $1.25 million
- West: $1.5 million
So where does your store fall? Average? Better than average?
Anecdotally, I know of stores whose turns are six or higher, as well as some whose turns are, unfortunately, well below one. Most stores tend to aim for three or higher. Keep in mind, too, that store sizes range from as little as 500–600 square feet to multi-level behemoths the size of city blocks, and all are pretty great in their own ways.
We also ran some reports to see which BISAC categories had the highest average turns and found a few surprises.
The supposition was that Fiction and Juvenile Fiction categories would likely be at the top. They were up there: Fiction came in at #4 with 2.56 turns and Juvenile Fiction was #5 with 2.37 turns. But Self-Help actually sat at the top of the list with a national average of 2.82 turns; Humor was #2 with 2.66 turns; and Sideline/Gift Items surprisingly sat at #3 with 2.59 turns.
Interestingly, Fiction and Juvenile Fiction account for about five times the sales of the other top 10 categories combined. This relates to something we often see: The categories that sell the most in a store are often pretty overstocked, with sometimes two-thirds of the inventory sitting stagnant and unsold. As a result, a category can be underperforming to the point of costing a store money, rather than being the high-performing revenue stream that it could or should be. Smaller categories often perform quite well, as the inventory is often tighter and more controlled. This means that a smaller well-handled section can technically bring in more revenue than a large, bloated category with higher sales. Translation: It’s better to have a $20 bill sitting in your bank account than gathering dust on your shelf.
Your challenge/homework, then, is to take a look at your turns and categories and see where you land. How do your store’s turns match against the average? Which of your store’s categories have the highest turns and which have the highest sales? Are they the same, or are your best-selling categories not pulling their weight as well as they could be?
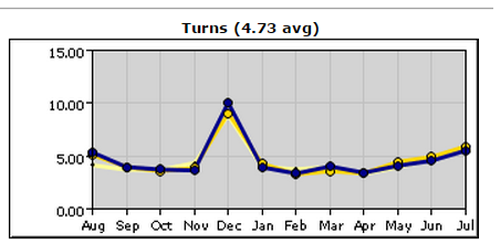
Treeline stores can see their turns by looking at the Trends screen, then Industry Standard: All. This will show your entire store. Set your timeframe so you’re looking at a year’s worth of activity:
See your top-turning categories all together using the Prioritize on Metrics screen, as shown here [7].
If you have questions, please don’t hesitate to contact [email protected] [8].